


Revenue dropped last quarter. Your FP&A team spent four days finding out why. According to Tellius's January 2026 analysis of FP&A operations, teams spend 3 to 5 days per financial close manually decomposing variances across price, volume, mix, and cost drivers, each in a separate Excel model, validated independently across CRM, billing, and finance. By the time the diagnosis was complete, the next cohort had already renewed at the wrong rate.
Automated root cause analysis changes this. A properly configured AI system tests every revenue driver simultaneously, across all connected data sources, and returns a ranked diagnosis in seconds. You do not need a large data engineering team to build this. But you do need to make a specific sequence of decisions in the right order.
Before you can automate the diagnosis, you have to define what a diagnosis is, connect the sources it needs to query, and ground the system in your actual data model. This guide walks through each step.
In this article
- What automated revenue RCA requires before you start
- Step 1: Map your revenue hypothesis tree
- Step 2: Connect your sources for parallel querying
- Step 3: Define what a usable output looks like
- Step 4: Build or buy the query layer
- Why data grounding has to come first, and the "revenue" problem that explains it
- Frequently Asked Questions
What Automated RCA Requires Before You Start?
Four inputs need to be in place before you configure any AI system for revenue diagnosis.
A defined hypothesis tree. Which drivers can explain a revenue shortfall? Price variance, volume shortfall, product mix shift, cohort renewal behavior, and channel mix are the standard categories. Your version will differ based on your business model, but you need to make it explicit before the system can test against it.
Connected data sources. Revenue diagnosis requires CRM data (deal composition, stage, close dates), billing data (recognized revenue, discount rates, churn events), product data (usage, expansion signals), and finance data (GL, recognized revenue schedule). The AI system needs to access all of these simultaneously, not one at a time.
A defined output standard. What does a useful diagnosis look like? "Revenue declined" is not a diagnosis. "60% of the margin decline traces to mix shift in two regions, with discount rates flat" is. You need to define the output standard before you build the system, because it determines what the system retrieves and how it presents findings.
A data-grounded query layer. The AI system needs to understand your specific schema definitions, metric ownership rules, and source-system hierarchies, not a generic approximation of them. This is the step most implementations skip. The final section explains exactly why, using a concrete example.
Step 1: Map Your Revenue Hypothesis Tree
A revenue hypothesis tree lists every driver that could explain a movement in your top-line number. For most BFSI organizations, the first level looks like this:
- Price variance: did average selling price or rate change?
- Volume variance: did transaction or deal count change?
- Mix shift: did the composition of products, channels, or customer segments change?
- Cohort behavior: did renewal rates, NPA roll-rates, or retention patterns shift?
- Channel contribution: did a specific acquisition or distribution channel underperform?
Each first-level driver breaks into second-level sub-drivers. Mix shift, for example, splits into product mix, segment mix, channel mix, and geography mix. The system tests all of these simultaneously, which means each one has to be explicitly defined.
Step 1 produces a structured hypothesis list. That list becomes the test plan the AI runs against your data. Without it, the system has nothing to test against, and the output becomes a narrative rather than a ranked diagnostic.
Step 2: Connect Your Sources for Parallel Querying
Most finance teams already have the data they need. The problem is that it lives in separate systems with no causal logic connecting them. More than 70% of Indian corporate treasuries still depend on spreadsheets for analytics and reporting, according to EY India's Corporate Treasury Survey from October 2025, and two-thirds cite weak reporting and dashboarding as a core pain point. The gap is not a lack of data. It is a lack of connected data.
CRM holds deal-stage data. Billing holds recognized revenue and churn events. Product holds usage and expansion signals. Finance holds the GL.
Connecting these sources for parallel querying means three things:
- Each source is accessible to the AI system with read-only credentials.
- The system knows which table in which source holds which driver from Step 1.
- Queries against different sources run simultaneously, not sequentially.
That third point is what changes the time equation. A manual analyst queries one source, builds a model, validates, then moves to the next. That is the 3 to 5 day cycle the Tellius data describes. An AI system with connected sources sends all queries at once and waits for results in parallel. The time from question to first diagnosis drops from days to seconds.
You do not need a unified data warehouse, a consolidated data lake, or a migration project to get started. The AI system can query source systems directly, as long as the grounding layer correctly maps the schema across them.
Step 3: Define What a Usable Output Looks Like
A useful revenue diagnosis has to be specific, ranked, and traceable.
Specific means the output names a driver, not a category. Not "volume declined" but "new logo volume in the enterprise segment declined 18% against prior quarter, concentrated in two geographies."
Ranked means drivers appear in order of their contribution to the overall gap. The finance leader sees the biggest cause first.
Traceable means every finding links back to a specific data point in the source system. Your analyst verifies the finding rather than reconstructing the data from scratch.
Here is what that looks like with real numbers. Query: "Revenue dropped $2M in Q2 vs Q1. What drove it"
Grounded AI output, returned in approximately 8 seconds:
| Rank | Driver | $ Contribution | % of Gap | Source field | Confidence |
|---|---|---|---|---|---|
| 1 | Mix shift: enterprise to SMB | -$1.2M | 60% | billing.segment_mrr | High |
| 2 | Enterprise renewal rate decline | -$600K | 30% | crm.renewal_rate by cohort | High |
| 3 | Pricing exception approved Q2 | -$200K | 10% | gl.discount_adjustments | Medium |
Each finding names exactly where the data came from. Your analyst opens billing.segment_mrr, filters to Q2, and verifies the $1.2M SMB shift in under five minutes. The reconstruction work is done. The decision work can start.
Compare that to the manual process.
- Day 1 queries CRM: deal volume is flat, so that is not the answer.
- Day 2 queries billing: recognized revenue is down, but by which segment? That requires another model build.
- Day 3 queries product for usage signals.
- Day 4: the cross-reference is finally complete.
Four days instead of eight seconds.
Step 4: Build or Buy the Query Layer
The query layer is the AI component that takes a hypothesis from Step 1, runs it against the connected sources from Step 2, and returns a finding in the format from Step 3.
Building it internally requires an AI reasoning layer capable of multi-step sequential queries across heterogeneous data, a harness that maps each hypothesis to the right source and field, a schema translation layer that handles ambiguity, and ongoing maintenance as schemas and metric definitions change over time.
The build-or-buy question really comes down to maintenance capacity, not build capacity. EY India's March 2025 research found that 74% of Indian financial firms have started GenAI proof-of-concept projects, but only 11% have reached production. The gap between pilot and production is almost never a model problem. It is a harness and maintenance problem.
Research on enterprise data agent accuracy consistently shows that harness design, not model selection, determines real-world production performance. How well you configure and maintain the harness against your actual data matters far more than which model you choose.
Buying means working with a managed AI platform that handles harness configuration and ongoing maintenance inside your own infrastructure. For most BFSI organizations, the maintenance burden is what causes implementations to stall between proof of concept and production.
Why Data Grounding Has to Come First?
Every step in this guide depends on one thing most implementations skip: the AI system needs to understand what your data actually means, not just what it looks like.
Here is the core problem, and it is more specific than "data quality."
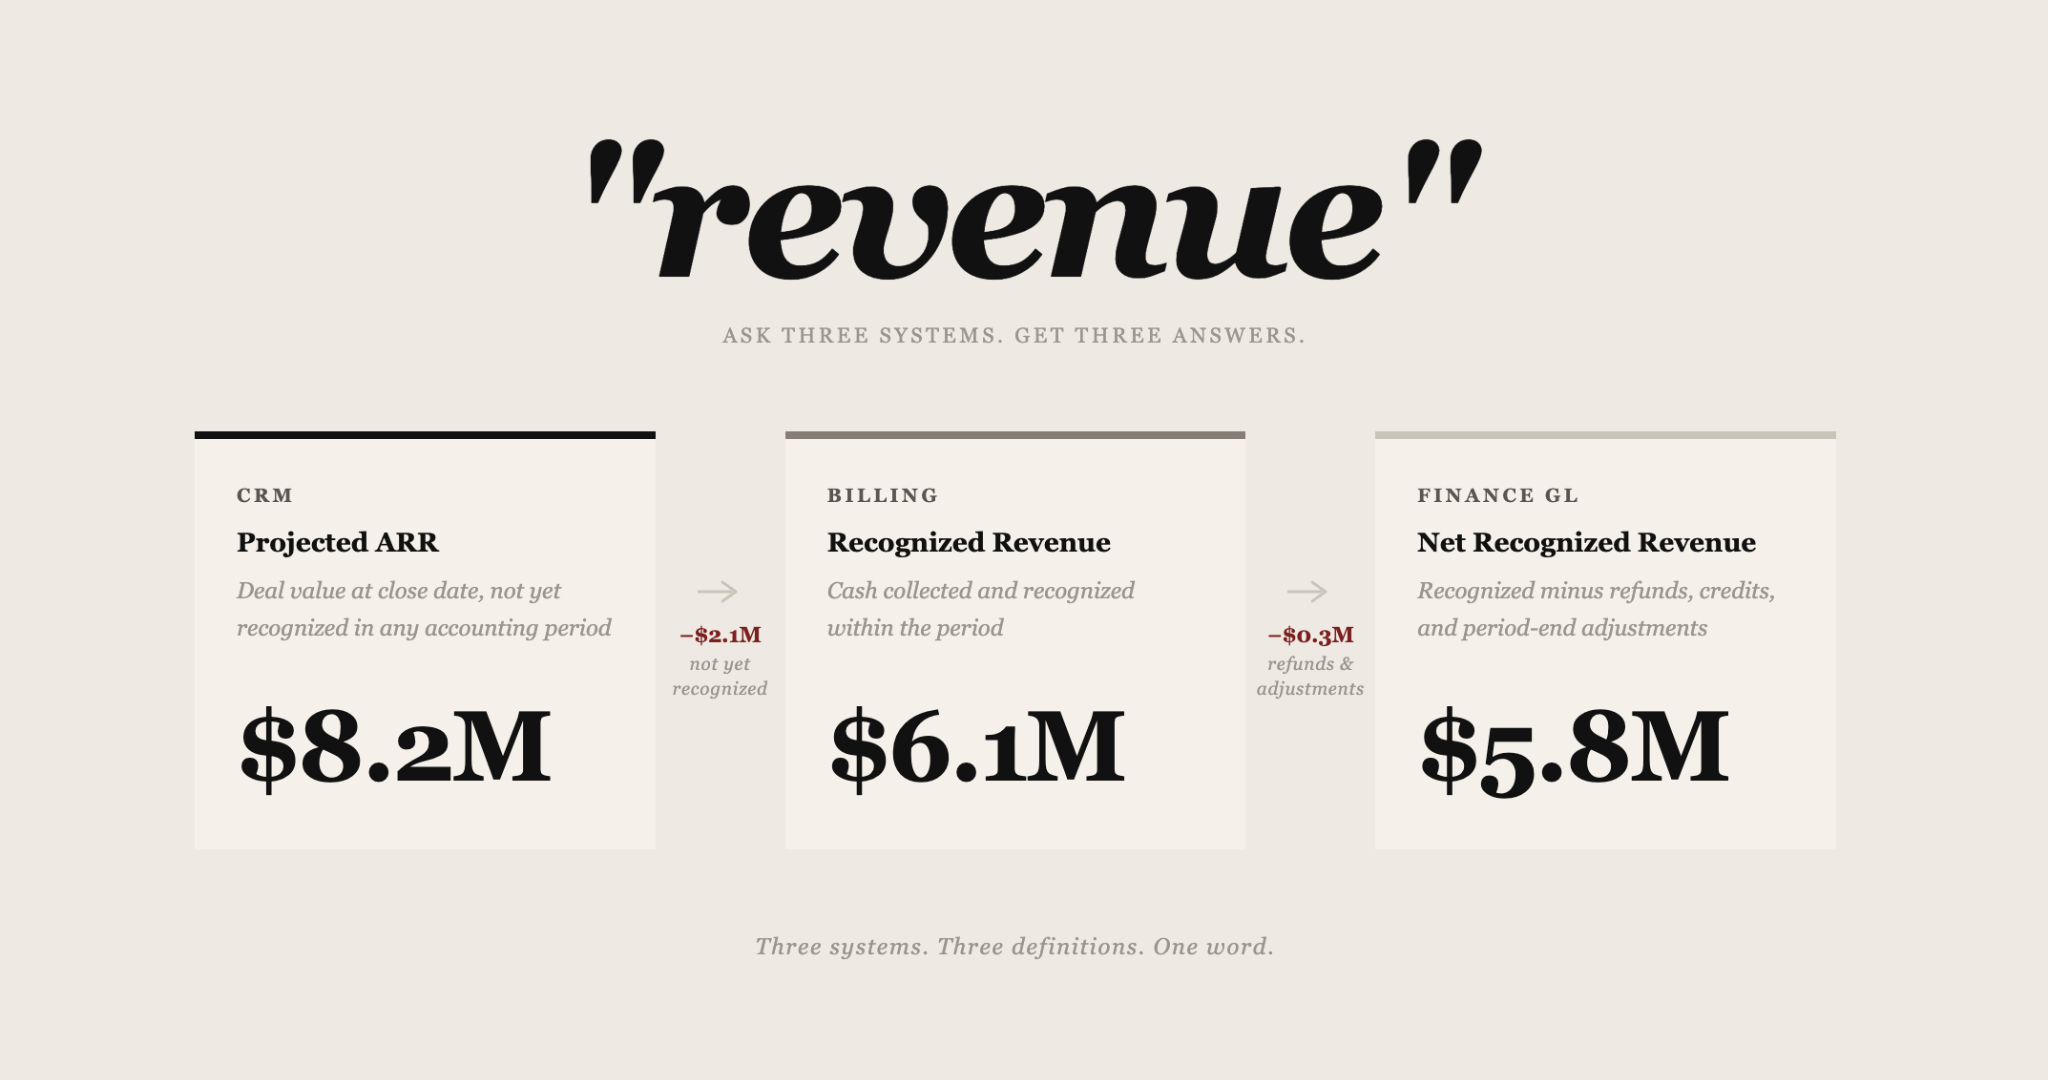
The word "revenue" means three different things across the systems a BFSI organization runs every day.
| System | Field | What it counts | Example Q2 value |
|---|---|---|---|
| CRM | Projected ARR | Deal value at close date, unrecognized | $8.2M |
| Billing | Recognized revenue | Cash collected and recognized in period | $6.1M |
| Finance GL | Net recognized revenue | Recognized minus refunds, credits, and period adjustments | $5.8M |
An ungrounded AI asked "why did revenue drop" might compare the CRM figure to the GL figure and report a $2.4M gap. That gap is definitional, not diagnostic. It exists because the two systems count different things. A grounded AI knows to query billing for recognized revenue by segment, and the GL for the adjustment breakdown separately. It does not conflate the two.
This is the schema ambiguity problem. It exists in every organization running more than one source system. And it is not limited to "revenue." The customer in your CRM is not the same entity as the account in billing. The product in the sales system is not the same as SKU in the product platform. Every entity that crosses a system boundary is a potential source of ambiguity.
Data grounding resolves this by mapping out, explicitly: which field in which system is the authoritative source for each metric; what transformation rules apply when aggregating across systems; what time conventions each system uses and how to normalize them; and which fields are read-only versus inputs to other calculations.
Without this mapping, the AI system approximates. It produces a plausible revenue narrative, not a traceable one. The diagnosis looks right until someone in finance checks it.
The DABstep benchmark, built by Adyen on 450 real-world financial data tasks, measures exactly this: can an AI system apply company-specific metric definitions precisely, with no room for approximation? At benchmark launch in February 2025, the best AI systems reached 16% accuracy. By July 2026, Actioneer v0.5 reached 93.78% on the same benchmark. The gap between 16% and 93.78% is the data-grounding gap, not a model capability gap.
Actioneer's performance on enterprise data reasoning benchmarks reflects an architecture that resolves schema ambiguity as the first step, before any reasoning begins.
For BFSI organizations in India, there is an additional requirement. The AI system needs to operate inside the institution's own infrastructure, with data that never leaves the organization's cloud. The grounding layer runs inside that perimeter, under read-only access controls, with every output linked to its source for audit purposes.
Actioneer operates as a managed AI platform. The grounding configuration, schema mapping, and ongoing harness maintenance all run inside the client's infrastructure, managed by Actioneer's team. The institution's finance and compliance team reviews outputs and makes decisions. Maintaining the harness is never the client team's problem to carry.
Frequently Asked Questions
How long does it take to build automated revenue RCA?
The timeline depends on how many data sources you need to connect and how well-documented the schema is for each. For organizations with documented metric definitions and accessible source systems, a managed deployment can return a first diagnosis within weeks, not quarters. The work sits in the grounding configuration, not the AI model selection.
Do we need a data warehouse or data lake before we start?
No. Automated RCA queries source systems directly with read-only access. A unified data warehouse speeds up some queries but is not a prerequisite. If your CRM, billing, product, and finance systems are accessible with read credentials, the system works against them directly.
What is the most common reason automated RCA implementations fail?
Schema drift. Source systems change: new fields get added, metric definitions shift, table structures are reorganized, and the AI harness falls out of sync. The diagnosis starts returning wrong answers, but the errors are plausible enough that the finance team does not catch them immediately. This is the primary reason EY India's research finds only 11% of GenAI proofs of concept reach production. Managed deployments with ongoing harness maintenance address this directly.
How do we verify that the AI diagnosis is correct?
Every finding in a properly grounded diagnosis links back to a specific row, field, or aggregate in the source system. Using the example above: if the AI returns "mix shift accounts for $1.2M of the revenue gap, source: billing.segment_mrr," your analyst opens the billing system, filters segment_mrr to Q2, and checks the number. If it matches, the finding is verified. If the AI cannot provide a source citation, it is producing a narrative, not a diagnosis.
Can we start with one use case and expand?
Yes, and this is the recommended approach. Start with one revenue driver category, say renewal rate variance or pricing anomaly detection, with one connected data source. Get the output format right and the grounding verified. Then expand to additional drivers and sources. Each expansion moves faster because the grounding framework and output standard are already in place.
How do we handle metric definitions that differ across business units?
Document the conflict before you build the system. The grounding layer needs to resolve which definition is authoritative for which query type, or carry separate mappings per business unit. This is one of the harder parts of a data grounding project, and one of the most common reasons internal builds stall after the first proof of concept.
Automated revenue RCA is a configuration problem before it is an AI problem. The steps are clear: build the hypothesis tree, connect the sources, define the output, choose the query layer. But all of it depends on a grounding layer that resolves schema ambiguity before any reasoning begins. Start there, and the rest follows.
Actioneer's managed platform handles the grounding, configuration, and maintenance for BFSI organizations that want the diagnosis without the infrastructure project. Book a conversation now.